How I Reduced Crypto Transaction Broadcast Time from 800 ms to 70–80 ms—and Built a Secure Client System Around It
How I rebuilt crypto transaction execution at the code level for a client, cut reaction time nearly tenfold, and wrapped it in a dashboard, Telegram controls and a hardened server.
Over the past week I spent a significant amount of time studying how crypto transactions actually work — not at the level of clicking a Buy button on an existing platform, but at the code level.
I wanted to understand the entire process: how software detects a relevant blockchain event, builds a transaction, adds the required instructions, signs it with a private key, and broadcasts it directly to the network. The question was simple: how much time can be saved by removing unnecessary intermediate steps and controlling the whole process in code?
This research became part of a larger system I was building for a client. The client needed a custom automation platform for Solana transactions that was fast, manageable and secure. My role was to design and build the architecture, the application and the infrastructure. The client defined the business logic and the operational scenarios.
For confidentiality reasons I am not sharing wallet addresses, private keys, exact conditions or the mathematical parameters behind the client's strategies. I can, however, explain the engineering behind the project.
From an existing platform to direct execution in code
One of the benchmarks we used was Trojan, a popular tool for fast operations on Solana. In our observations, execution through Trojan took approximately 0.8 seconds — about 800 milliseconds. That is already fast from the perspective of a regular user. In a system that reacts automatically to blockchain events, even a small delay matters.
The first working version of my own transaction module reduced that path to roughly 200 ms. A major improvement over the benchmark — but I could see unnecessary delays still remained inside the process.
What followed was a series of tests and measurements. I measured each part separately:
- data preparation time;
- transaction construction;
- cryptographic signing;
- blockhash retrieval and age;
- latency for each broadcast channel;
- the complete path from event detection to network broadcast.
To reduce latency, I moved everything that could be prepared in advance off the critical path:
- the blockhash is refreshed in the background;
- reusable transaction components and public keys are cached;
- the cryptographic hot path is warmed up when the process starts;
- on-chain data already available from the event is not requested again;
- the same signed transaction is broadcast simultaneously through two independent channels;
- the system accepts the first successful response instead of waiting for the slower endpoint.
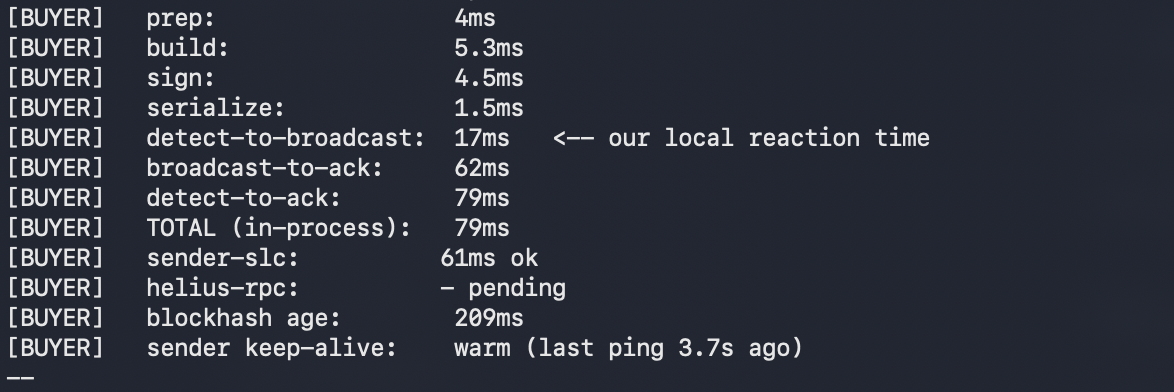
During optimized warm benchmark runs, the local construction stage has reached approximately 2–3 ms, with signing completing in under 2 ms. The exact numbers vary depending on runtime conditions, but the complete live detection-to-acknowledgement path now typically falls within the 70–80 ms range.
An important distinction: this is not the time required for final blockchain confirmation. It measures how quickly the system detects an event, prepares and signs the transaction, broadcasts it, and receives the first acknowledgement from a network endpoint. Compared with the approximately 800 ms Trojan benchmark observed during testing, this represents nearly a tenfold improvement.
Independent scenarios, not one large script
Speed was only one part of the assignment. The client also needed an administrative dashboard to manage the system without changing code or connecting to the server every time. Through the dashboard the client can:
- add public wallet addresses to monitor;
- assign different operational wallets to different scenarios;
- enable or disable individual strategies;
- change permitted parameters;
- view active operations and waiting queues;
- monitor connection and synchronization status;
- review history, charts, errors and live logs.

The project currently supports two operational scenarios, with a third already planned. It was important not to combine them into one tightly coupled script. Each scenario has its own settings, watchlist, wallet context, states and activation rules, and they run in parallel without interfering with one another — while reusing common infrastructure for Solana connectivity, transaction construction, monitoring, logging and interfaces. New scenarios can be added incrementally without changing the behavior of the existing system.
An error or temporary data loss inside one module should not stop the whole application. The system also makes a strict distinction between UNKNOWN and ZERO: a failed RPC request is never treated as proof of a zero balance. Potentially dangerous actions stay blocked until the data source recovers and the system re-synchronizes.
Management through a web dashboard and Telegram
The system provides two management interfaces. The web dashboard handles full configuration and diagnostics. Telegram is the operational channel: the client receives notifications about events, completed operations, state changes and errors, and can perform the supported manual actions.
The client never needs to open a terminal, edit files on the server, or contact the developer to change a parameter. Complex server-side logic is presented through an accessible interface.
Security was just as important as speed
Once an administrative interface is online, automated scanners find it almost immediately. Cloudflare recorded approximately 3,000–5,000 automated requests and scanning attempts per day against this project. Not every request is a targeted intrusion attempt — but it shows why security cannot be an afterthought when a system works with wallets and sensitive credentials.
I audited the application and the server infrastructure, then reduced the exposed attack surface as much as reasonably possible:
- unnecessary external ports and services closed;
- access to the administrative interface restricted;
- API endpoints protected with authentication;
- public configuration separated from secret data;
- insecure server access methods disabled;
- server access protected with cryptographic keys;
- sensitive information filtered from logs;
- invalid addresses and configuration values rejected;
- hard operational limits to protect against configuration mistakes;
- the selected public wallet verified against the private signing key before a transaction can be signed.
Private keys are never stored in the dashboard. They stay in protected environment variables on the server, are never returned through the API, never appear in logs, and are never sent through Telegram.
I would never claim any system is impossible to breach — absolute security does not exist. What this project has is a layered model: discovering the dashboard address alone should not provide access to bot controls or any sensitive credentials.
Testing for reliability
A major part of the project was testing not only successful operations, but what happens when parts of the system fail. It currently includes 287 automated checks across 17 test suites, covering duplicate events, unavailable RPC services, malformed WebSocket data, queue overflow, timeouts, stalled endpoints, key mismatches, manual state changes, and isolation between separate scenarios.
The system records timing metrics, technical events and state transitions for every operation. If something goes wrong, the sequence can be reconstructed and diagnosed instead of guessing.
The final result
- a low-latency Solana transaction module;
- ~70–80 ms from on-chain event detection to transaction broadcast;
- two autonomous operational scenarios, architecture ready for a third;
- addresses, wallets and settings managed through a web dashboard;
- notifications and operational controls through Telegram;
- a hardened server with a minimized attack surface;
- complete isolation of private keys;
- history, diagnostics and live performance metrics;
- 287 automated checks.
This project shows how much the result can change when you move beyond the interface of an existing platform and start working with what happens underneath it: network requests, transaction instructions, cryptographic signatures, queues, state management, milliseconds and infrastructure security.
These are the projects I find most interesting — not writing an isolated feature, but building a fast, reliable and understandable system around a specific client requirement.
Want something like this built?
See the projects on the home page or reach me on WhatsApp.